
Using Map Server for Submitting Observations to Road Watch
Overview
Map Server is a software program that allows any computer user with Internet access to customize maps specific to his or her needs. In the case of this project, users can use the map interface to mark the locations of wildlife crossings on Highway 3. The map has been set up with layers (spatial themes, such as roads and rivers) to assist you in marking locations of where you have seen wildlife cross Highway 3. The opening map interface highlights the study area from the Alberta/ British Columbia border to Lundbreck. The spatial layers portrayed in this view include Highway 3 and associated roads, railway, major towns and a background image of Digital Elevation Model (DEM). Please do not mark your location on this view, instead use the zoom in or jump to box to change the scale of the view portrayed on the screen to mark a more accurate location. Instructions on how to zoom in are provided below in the submitting an observation section.
Note: Unfortunately, computer users connected to the internet with a dial-up internet connection with speeds of 28.8 kb/s or less will require considerable patience as they wait for large files to download. The tool is best suited to users with high-speed cable or ADSL connections. Users with dial up can address the speed issue by:
- Selecting the low-speed version on the page that appears when your select submit observation. In this version the background images will not appear automatically. You can turn these images on any time by selecting them in the legend and refreshing the map. More detailed instructions on using the map are described below.
- Once you have loaded the interactive map, use the jump to location box in the upper right hand corner of the map to narrow in on the region of interest. This is the fastest way to zoom into a scale where local landmarks are indicated and you can mark your observation. More detailed instructions on using the map are described below.
Tool Descriptions
To access a tool simply click on top of it with your mouse.
 Zoom In: Allows you to zoom in on a particular area by one of two methods: 1) click a spot on the map to zoom in there; or 2) click and drag a rectangle around the area to which you want to zoom.
 Zoom Out: Allows you to zoom back out by one of two methods: 1) click any place within the current map view or 2) click and drag a rectangle around the area you want to zoom out.
 Zoom to Full Extent: Zooms to show the full extent of the map. In this case the study area from the Alberta/ British Columbia border to Lundbreck.
 Pan: Like sliding a paper map across a table, ‘Pan’ allows you to move the visible extent of the map manually by clicking and dragging.
 Mark Observation: Allows the user to pinpoint where the wildlife was observed crossing the road.
 Ruler: Measures the distance from one point to another as defined by the user. To start measuring, click on a point on the map. To turn corners, click once and continue. To stop, double click. A distance measure in metres is portrayed at the bottom of the page.
 Update Map: Use when a layer has been turned on or off in the legend and you want to refresh the view. The more layers the user selects, the longer it takes to refresh.
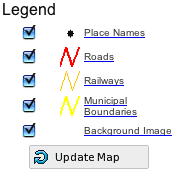 Turning Layers On and Off
The map layers represented have been set up to assist the user in accurately marking where wildlife were observed crossing the road. Once the users zoom in, new layers will appear that identify local landmarks and rivers. Additionally, once zoomed in an image (IRS: 5 m resolution) appears as a background image. Users who have dial up should consider turning this layer off to increase speed and performance of the mapping tool. To turn off the layer click on the box with a checkmark in the legend beside IRS imagery and then select the (update map button). You can turn other layers on and off as needed throughout your session.
Submitting an Observation
For the purpose of this tutorial let’s say you observed a mule deer crossing the road at approximately 500m west of the Leitch Collieries Historical Site turn off.
- Select the Submit Observation button on web site home page. This will take you to the map interface:
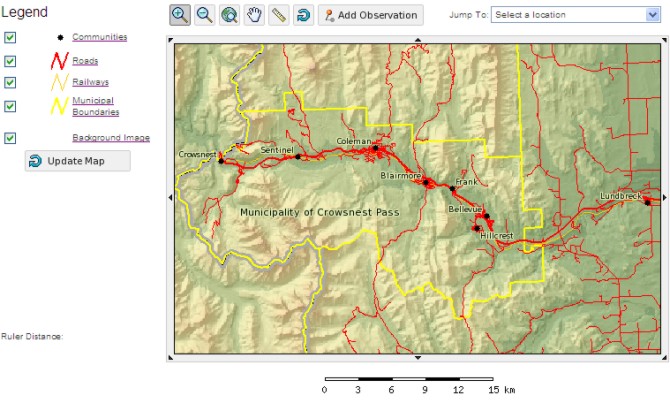
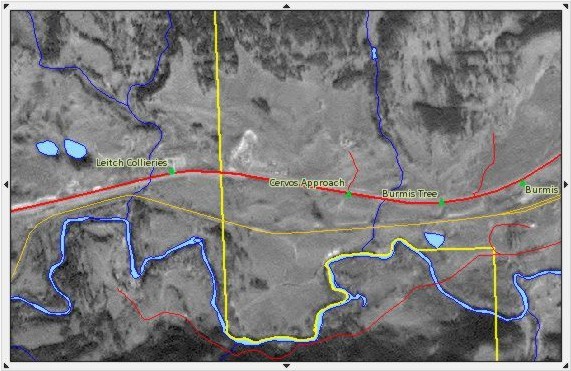
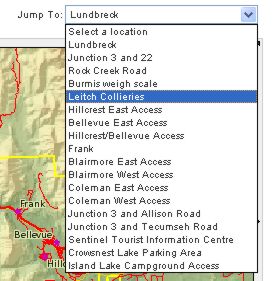 Use the (zoom in) button or jump to box to zoom into the area you are interested in. In this case we will use the jump to box and click on Leitch Collieries. This will take you to a zoomed in view of the Leitch Collieries Area. Note that at this scale there is a new background image, an air photo, rivers, lakes, railways and local landmarks appear to assist you in marking your observation. Additionally, Highway 3 is represented with a thicker line than other roads.
- Select the (Zoom in) tool and draw a box around Leitch Collieries. The box will be highlighted in red and the map will update to the view represented by the box. If you make a mistake on the size of the box you can use the (zoom out) or the (zoom in) to adjust the size of the image. You can also use the Jump To box again to refocus the selection on the Leitch Collieries.
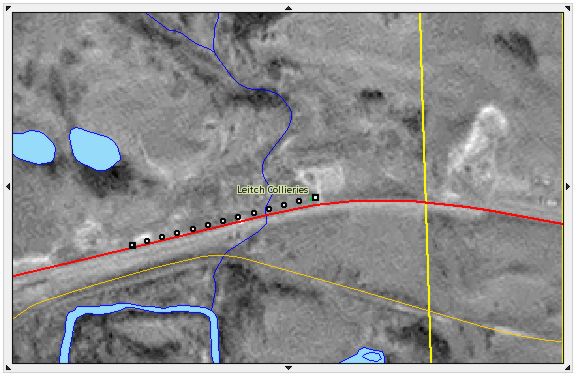
- From your zoomed in view around Leitch Collieries select the (ruler) tool to measure 500 East of the Leitch Collieries. When using the ruler tool, click once to begin measuring, every click will add vertices, to stop measuring double click the mouse. Note that when you change to the mark observation tool the ruler disappears and so you need to remember approximately where the location 500 m is.
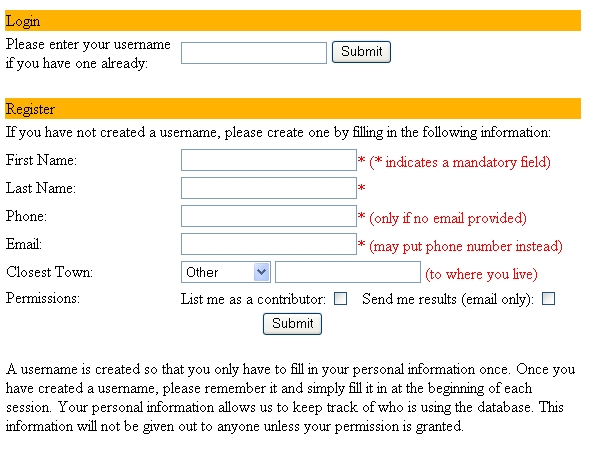
Dist: 500m - You are now ready to mark your observation location on the map. Select the (add observation) tool and click on the point 500 m West from the Letich Collieries Historical Site. After marking your location on the map, a new window will pop open asking for your username. If this is your first time using the site, fill in the register section. The red stars indicate that the fields must be filled in. When you have completed the register please submit.
After you have submitted your registration, the following form will pop-up. Please note that you only have to fill in the register once, if you remember your log-in provided at the top of the new form. You will only have to log in at the beginning of a session.
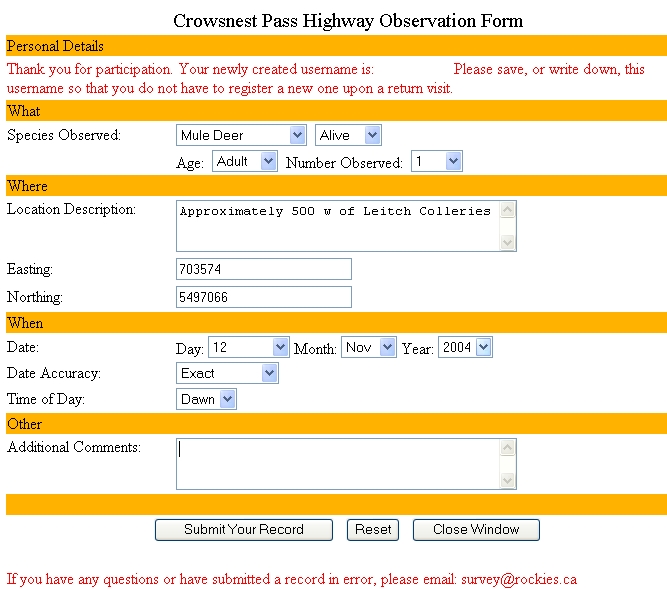
- Once the form has been completed, select the submit your record button on the bottom of the form (please do not submit records if you are just practicing, instead chose the close window button). If you make a mistake on this form, you can reset the page at the bottom of the screen. If you are not happy with your marked selection on the map, select close window to return to the map page to try again. If you submit your record you will return to the map page and a "big red star" will indicate where you marked your observation.
- Now let’s return to the initial view of the study area to start again. Select the (zoom full-extent) to return to the original view. You can continue to add other observations. Your previous observation will remain as a red start until you have ended your session.
- To get back to the home page of the web site, close the mapping window by clicking on the X in the top right hand corner of the page.